- Mingdom
- Posts
- Mingdom Capital 2025 Q3 Update
Mingdom Capital 2025 Q3 Update
Google is finally not dying to AI; Portfolio +26% YTD, near ATH.
Dong Ming
October 06, 2025
I started sharing my long term, stock-only portfolio on SavvyTrader since Feb 1, 2024. I also trade options and do many shorter term swing trades but that won’t be included in this portfolio. My goal for the Mingdom Capital portfolio is to beat the SPY consistently over the long term in performance and risk-adjusted returns.
Portfolio Review
Performance:
As of end of Q3, the portfolio continue to beat both SPY and QQQ. With a 11% gains over the last 3 month and 26% YTD compared to 14%/17% for SPY/QQQ.
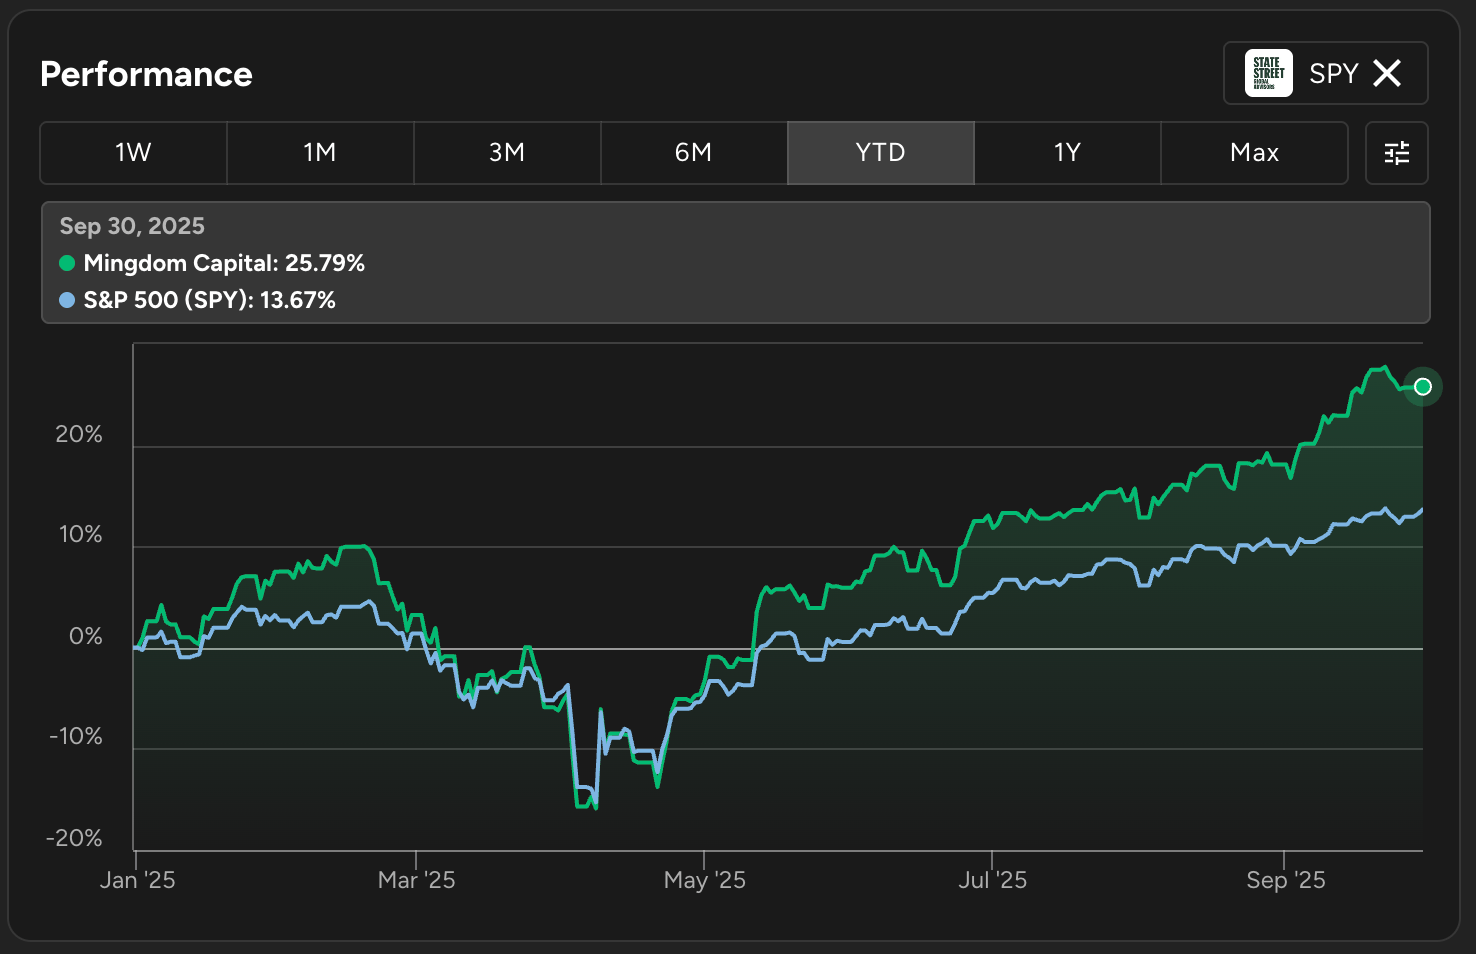
Portfolio vs. SPY
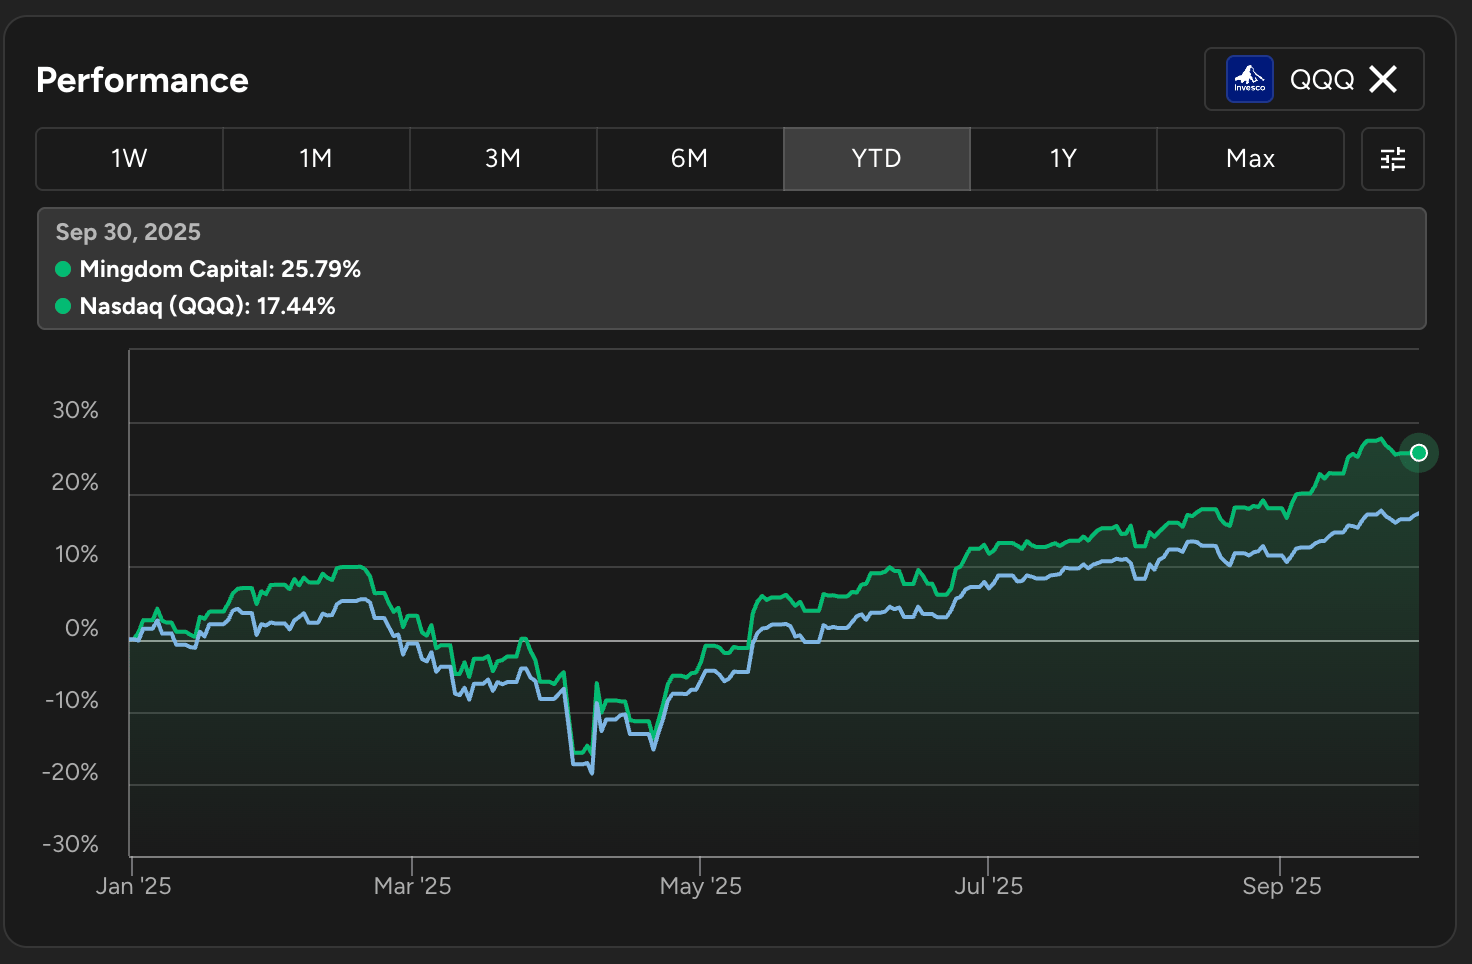
Portfolio vs. QQQ
Additional Stats
It’s not enough to beat the SPY, my other goal is to have better risk-adjusted returns. This can be measured with Sharpe and Sortino ratio. I wrote a quick CLI tool that imports my portfolio data from SavvyTrader API and output some additional stats:
  Metric       │   Mingdom   │   SPY │   QQQ │   ARKK
 ══════════════╪═════════════╪═══════╪═══════╪════════
  CAGR         │       33.7% │ 20.1% │ 22.5% │  39.0%
  3M           │       11.3% │  8.1% │  9.0% │  22.8%
  YTD          │       25.8% │ 14.7% │ 17.9% │  52.0%
  Max Drawdown │       -9.2% │ -5.9% │ -7.7% │ -14.5%
  Sharpe       │         1.7 │   1.3 │   1.2 │    0.9
  Sortino      │         3.1 │   2.3 │   2.2 │    1.9
Thoughts:
The max-drawdown of 9.2% isn’t great compared to the benchmarks. The main reason for a worse drawdown is because of APP (Applovin) went from $500 to $240 in the course of one month as 4 different short sellers piled on. Thankfully I held on through the lows but have reduced / taken profit on it as it recovered. It’s now $680 and was almost $750 at one point!
Sharpe and Sortino ratio are both used to measure risk-adjusted returns. I prefer Sortino because it doesn’t penalize your portfolio for having volatility for the upside (because I’m fine with my portfolio violently moving up, just not down). So it’s great to see a Sortino of 3.1, much better than SPY, QQQ and ARKK.
The reason I listed ARKK as a benchmark above is because high Beta and small caps have outperformed SPY significantly recently. But when meansured with Sortino you can see it’s quite terrible at 1.9. This means despite the higher performance, ARKK is worse for risk-adjusted return than SPY and QQQ (should be obvious but maybe not in this environment).
Top Positions
Here’s the current top 13 positions in my portfolio as of EOD September 30, 2025:
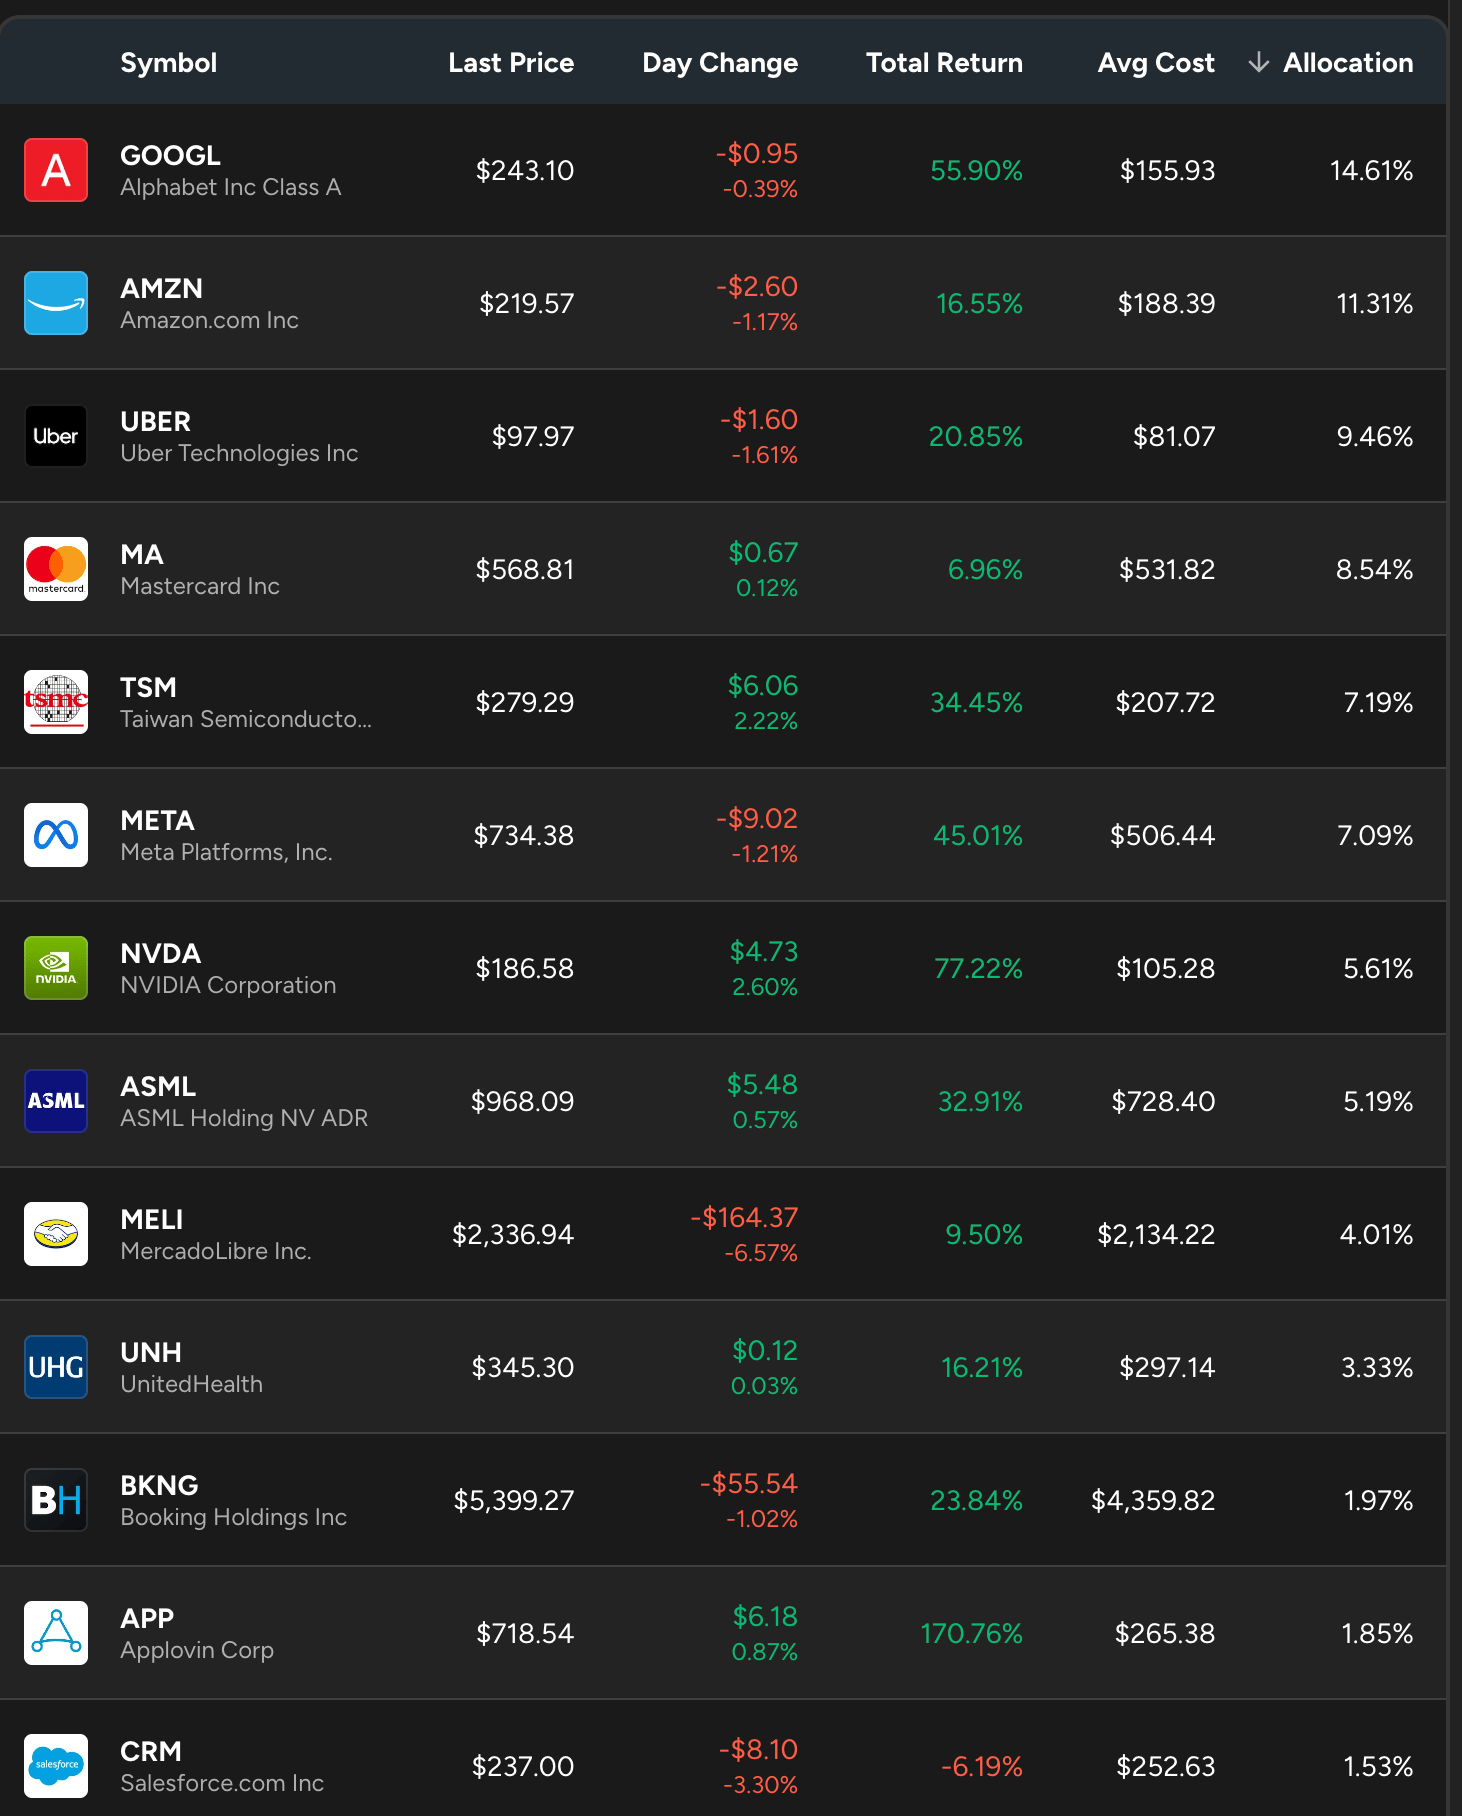
Source: SavvyTrader
Here’s how they performed so far this year:

Source: Seeking Alpha
Portfolio is top heavy, top 10 = 76%, top 13 = 80%.
In the Q2 review, my top 13 were GOOGL, AMZN, META, MA, TSM, MELI, NVDA, UBER, BKNG, MSFT, ASML, INTU, APP. Notable changes and thoughts below:
UBER went from 8th place to 3rd. I aggressively added recently.
UNH is now top 10. I want more exposure to healthcare and biotech stocks to diversify my portfolio. I’m also actively researching more opportunities in this space.
TSM and ASML higher weighting, mostly due to higher performance.
Trimmed / took profit on META, NVDA, APP.
Reduced MSFT and INTU and put it towards CRM and ADBE instead.
Last time I wrote “My top two positions in GOOGL and AMZN were actually biggest laggard in performance so far this year…”, Google went on a huge run last quarter so now I’m just waiting on Amazon =)
What I’m learning or changing my mind on
Trading & Technical analysis
I started a separate swing trading account earlier this year and I’ve been learning a lot more about technical analysis and trading in general. I previously wrote that this isn’t a game I’m looking to compete in but after exposing myself to top traders on Twitter, I’ve concluded there is real edge in learning to trade even as a long term investor. It helps to use technical signals to determine when to take more or less risk both at an overall portfolio level and on a per-position basis.
Trading is largely about following existing trend, so traders will sell when a stock tanks whereas investors will buy when a stock tanks. Very different mindset and it’s worth understanding the other side.
This is just a side quest with a small percent of our net worth mostly for fun and education until I can prove my edge in the space.
Options Flow Analysis:
I’ve also concluded that there is insane edge in learning to analyze unusual options flow. This is similar to the point above because both technical analysis and options flow analysis generates ideas that I would otherwise never consider if I just look at fundamentals.
I’ve executed multiple options trades based mostly on unusual institutional flow that have been multi-baggers. Among those TSLA, CRWV, MU, BIDU, BTU.
Since the active trading and options trades are not part of the Mingdom Capital portfolio, I’m not going to go into them with any detail here. You can follow me on Twitter if you want to see more.
Thoughts on the market / What’s next?
The subtitle of the Q2 update was “Extreme Greed is back... but this time I'm Bullish?”. I’m glad I kept risk on as the market shrugged off what’s usually a seasonally weak September and pretty much rallied for the entire 3 months.
At the moment I’d say I’m more cautious than in Q2, but my base assumption is that the rally continues at least until EOY and any major dip will get bought. I’ve taken way more profit this year so far than last year and my hope is that we can have a chill rest of the year so I don’t need to take more profit / pay more taxes =)
Fear & Greed index is actually Neutral (54) right now even though the market is ATH and shiller PE is over 40, which is higher than the 2021 peak. For more metrics to gauge the market, I highly recommend the SubuTrade substack, the latest issue is here: https://www.subutrade.com/p/markets-report-when-pullback
The one metric I’ll call out from that post is corporate insiders:
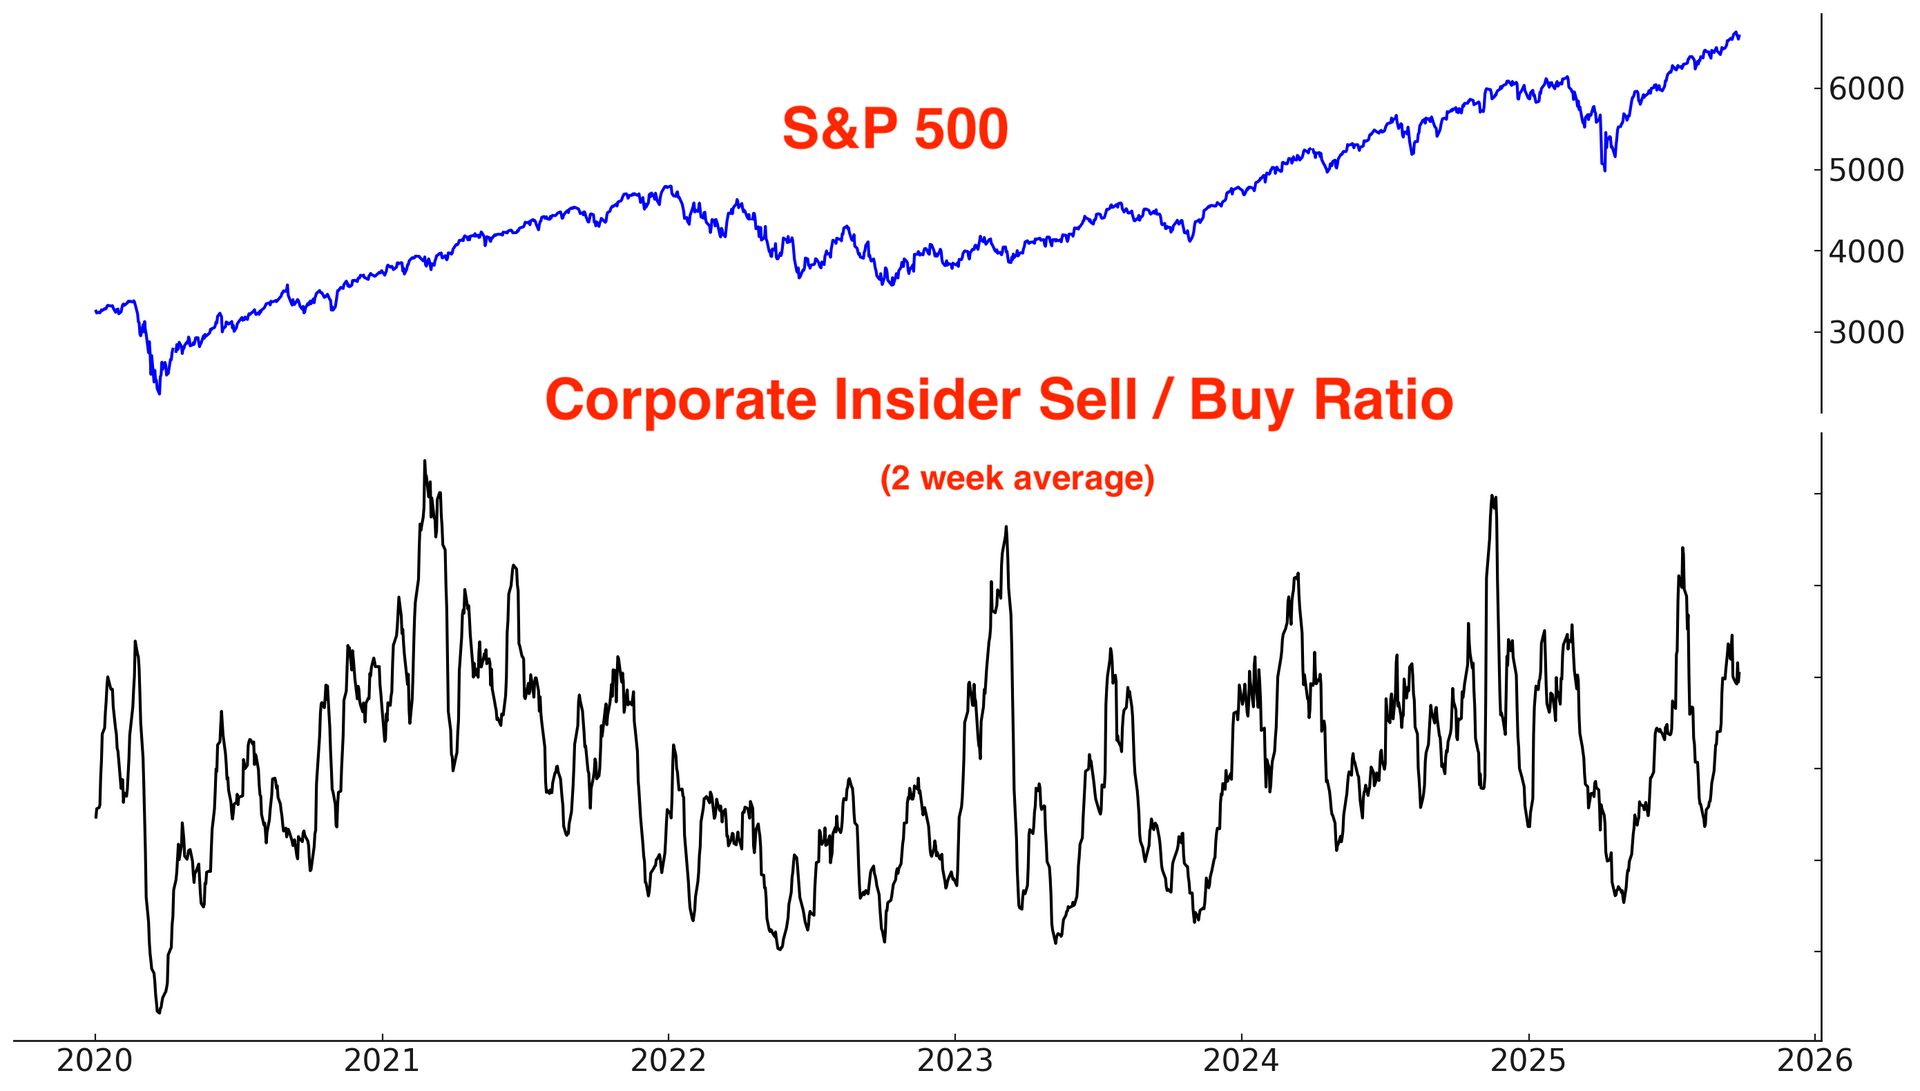
Source: subutrade.com
I remember distinctly at the end of 2021, big tech CEOs like Zuck, Elon and Sundar were all unloading record amount of shares selling their own stock. You can see we are no longer near that now. In fact, on this metric we are lower than even end of 2024. This tells me that despite the otherwise obviously frothy market, we might not be at the peak of this cycle.
My personal view is that this bull market can run for longer but I can easily understand others being bearish here because there are tons of data to support that as well. I just see strong evidence that AI is increasing productivity. Many say that the spending on AI is out of control and this is a bubble, but the flip side is that the additional spending is also driving investments and growth, without which we would likely already be in a recession.
More and more, I don’t care so much about predicting where the market is going and instead I want to make sure I’m prepared in the event of major changes. Learning from the trading community, the main indicator I’m going to watch for is whether SPY and QQQ are trading above the 21D EMA. Currently both are way above so I’m going to keep riding this uptrend.

SPY chart last 3 months, solid red line is the 21D EMA
As I’m wrapping up this post, I found a post on Twitter that accurately captures my stance: “selling a little into strength” and devise a careful plan of how I will manage volatility”. That’s more or less the plan =)
I made a post the other day that I am going to have a more cautious tone going forward. That does not mean I am bearish or shorting anything but rather I am selling a little into strength and have devised a careful plan of how I will manage volatility.
Furthermore, I am still
— SixSigmaCapital (@SixSigmaCapital)
10:17 PM • Oct 5, 2025
Hoping for a chill Q4, until next time!
Reply